RDA Dip Interpretation Suite
from ResDip Systems


P. O. Box 131201
The Woodlands, TX 77393-1201
Phone: +1 281.367.0843
- ■Input of 3D Seismic or Generic Gridded Data – 3D seismic horizons in the form of regularly-spaced lines and cross lines can be input and displayed in cross sections. The lines and cross lines do not have to be orthogonal to the coordinate system, only orthogonal to each other. In addition, gridded horizon surface data may be input. Coming soon - the ability to calculate dips at borehole/horizon intersections and to interpolate dips between intersections. These dips will then be used to calculate TST for geosteering, structural modeling, and well planning.
- ■Fracture Frequency versus Density – A new relationship has been derived that can accurately correct fracture frequency, a 1D measurement, to 3D fracture density. In this new relationship, not only is the orientation of the fractures to the borehole taken into account, but also the fracture size relative to the borehole size. For more details go to this document.
- ■Multi-Well Rose Maps – Rose plots from individual wells can be shown in map view. Rose plots may be dip azimuth for beds or strike azimuth for fractures. Optionally, polar plots may be displayed behind the rose plots.
- ■In-Line Picture Plots – In the Vector Section Window and Horizontal Well Tracking Window, picture plots (JPEG, BMP, TIFF, EMF, or WMF files) may be inserted as background. This is especially useful in displaying seismic behind the borehole.
- ■Conversion of Borehole Coordinates from True North to UTM Grid North – At higher latitudes, UTM coordinate systems can be significantly rotated relative to True North, especially away from the central meridian. RDA will calculate coordinates relative to Grid North for borehole deviation calculations, which normally assume True North. If not corrected, coordinate calculations for horizontal wells can be off hundreds of meters.
- Shadow Zone Polar Plots - Help visualize the effect of borehole orientation on fracture frequency. By using the analogy that the borehole is a detector, the attenuation in fracture density can be calculated based on the angle that the borehole makes with a fracture. Contouring the attenuation on a polar plot can give you an idea of how much the borehole orientation might be affecting the fracture frequency. For a short technical paper describing the concepts behind shadow zone polar plots, see Fracture Frequency and the Relationship of Fracture Orientation to Bedding and Borehole Orientation.
- Fracture Frequency and Density Logs - Plot the relationships between fracture frequency and fracture density on logs. Fracture frequency and density calculations can be exported for use in other programs.
- Dip Types - RDA allows many dip types to be present at one time. Dip types can be individually hidden from the program. In addition dip types can be selected for special purposes such as calculating true vertical and true stratigraphic thickness.
- Fracture Dip Types - Dip types can now be defined as being fractures. This separates them from other dips for special treatment in fracture analysis as well as plotting.
- Fracture Sets - In RDA, fracture sets can be selected based on dip type as well as orientation. The term "fracture set" is somewhat broader than the traditional meaning, because fracture sets can be used to group fractures for specific applications. For instance, borehole breakout is sometimes used to define fractures, but these should only be used in the qualitative sense, since the exact orientation is unknown.
- Quick Plots - The Quick Plots feature (formerly "Single Plot Windows") has been redesigned and extended to include most plot types. Quick Plots are especially useful when the plot window has a plot already. In addition to printing the quick plots, you can also save the plots to a picture file.
- Vector Sections™ -- Similar to vertical sections used for viewing horizontal wells, Vector Sections™ are 3-D entities created by using averaged dip data for vectors and true stratigraphic thickness to build realistic cross sections. Unlike vertical sections, Vector Sections can be used to display vertical wells.
- Structural Dip Modeling -- The use of Vector Sections™ and stratigraphic template logs to interpret structural dips and faults as well as formation tops. True stratigraphic thickness is used to model the effect of changes in dip or faults on a template log from an offset well. This differs from traditional geosteering techniques which use relative position to stretch and squeeze the log in the well to match a template. Structural dip modeling can be used for geosteering in complex structure, even in vertical wells. Vector Sections™ can be viewed in a 3D window to analyze structural relationships.
- Program Windows -- These analysis and utility windows are designed for viewing at screen resolution. Program-window plots plots can be printed directly or transferred to the Plot Window. The windows are also well-suited to screen capture.
- Many different plot types
- The Plot Window allows intuitive, visual handling of single plots or combinations of plots. Plots can be annotated or moved or new plots can be added. These high-resolution plots can then be sent to the printer or saved to picture files for use with other programs. Picture files can also be imported from other programs. The Plot Window is like a plot preview window with extended capabilities. When a project is saved, the plots in this window are also saved.
- Input/Output abilities include LAS, user defined, comma-separated, and tab separated. Depth variables can also be output to tables.
- Calculations -- include
dip rotation, true vertical depth, true stratigraphic thickness, true
vertical thickness, dip averaging, borehole deviation, best-fit fold
axis, SCAT.
- TVT and TST Calculation - The most accurate possible 3-D calculation of true vertical thickness (TVT) and true stratigraphic thickness (TST). For a complete explanation of the calculation methods, go to Calculating True Stratigraphic and True Vertical Thickness.
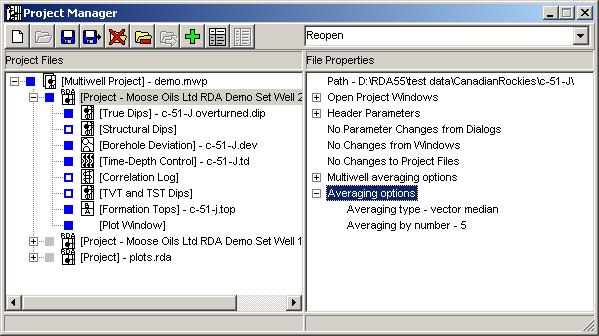
- Projects -- Plots, input files, and parameters can be stored in project and multiwell project files. The explorer-style project manager shows major project parameters and allows access to them.
- Multiwell module -- for creating multiwell sections (stick plots) and maps. Can also be used for borehole trajectory tracking of sidetracks or close-in development wells
-
This Windows-based program is designed for both structural and stratigraphic interpretation of dips from dip logs or formation imagers. Requires Windows XP or later. The network version will run on Windows and Novell servers.
■New in Version 8
Dip logs are 3-D logs
One may ask "isn't it enough just to color the dip patterns?" The answer is almost always "no", because dips are 3-D entities and pattern-coloring is essentially a 2-D exercise. As the applets below will demonstrate, the presence of even moderate structural tilt can completely change the configuration of dips such that the standard explanations for color patterning are no longer valid. In addition, scatter in dip measurements can obscure smaller, more subtle patterns, while at the same time introducing spurious patterns. In the applets that follow, you can interactively examine the effects of rotation and scatter on interpretation and explore some methods used in RDA to overcome these problems.
Others may ask "I can see the rocks clearly on my formation-imaging log, what will the extracted dips show me that the image will not?" Again, the problem is that borehole images are 2-D representations while extracted dips are 3-D. Anyone who chooses to ignore the dips is ignoring valuable structural and stratigraphic information.
Interactive examples explaining some of the techniques used in RDA
Rotation for removal of structural tilt is an essential part of dipmeter analysis. Before viewing the applets below, you can get an explanation of rotation in "A Simple Example of Structural Tilt and Rotation".
In the examples below, click on the hyperlinks to view the applets. It is recommended that they be viewed in order.
There are two related examples demonstrating the need for rotation and how to apply it. First, "The Effects of Structural Tilt" shows what happens to dip patterns when structural tilt is imposed on a section. Second, "Removal of Structural Tilt" shows how to undo the effects of structural tilt, by use of rotation, in order to objectively examine dip patterns.
Nearly all dip logs have some amount of scatter. The scatter can interact with tilt to interfere with interpretation. "Interaction of Scatter and Tilt" demonstrates how these two phenomena can affect interpretation. One aid in interpreting scattered dip data is smoothing, demonstrated in "Smoothing Dips to Reduce Scatter." Another useful method for interpretation of scattered data is synthetic deviation.
If you would like more detailed explanations of some of the techniques used in RDA, you can download a technical document (327KB) as a self-extracting executable of a Microsoft Word document.
Plot examples:
In the list below are some plots created within the RDA program. The plots below have been exported and inserted into Microsoft Word documents.
- Shadow Zone Polar Plots
- Fracture Frequency and Density Logs
- Vector Section example
- Dip log and polar plot indexed by depth color
- Dip log and polar plot indexed by dip type color
- Fold axis plot
- Rose diagram indexed by depth color
- SCAT plots showing dips used for best-fit transverse azimuth in red
- SYNDEV example of a low-dip angular unconformity
Buy now!
Many of the interpretation features in RDA are not even available on workstation programs at many times the cost. Contact address--USA and International: crberg@resdip.com Canada and UK: Andy@MooseOils.com
Contact Us:
New Effective Medium Water Saturation Papers
- A New Effective Medium Algorithm for Calculating Water Saturation at Any Salinity or Frequency
- Dual and Triple Porosity Models from Effective Medium Theory
- Guidelines for Effective-Medium Shaly Sand Water Saturation Calculations
- Statistical Comparison of Electrical Efficiency Theory to Archie's Equations and Effective Medium Theory
- Geosteering Using True Stratigraphic Thickness (PDF)
- Geosteering Using TrueStratigraphic Thickness (Powerpoint)
Page created by:
crberg@resdip.com
Changes last made on:
06/27/18 05:58 AM