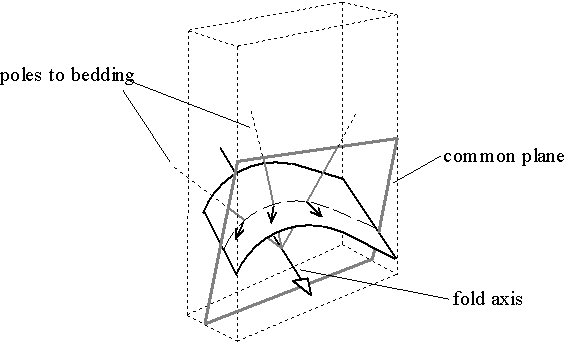
Fold axis analysis is based on the fact that poles or normals to dip will lie on a plane in a cylindrical drag fold. Although the strike of this axis is not the strike of the fault, it is the strike of the fault cut drawn on a map. Even in situations where the strike of the fault plane is the desired result, having the fault cut direction can aid greatly in making the fault plane map. In RDA, the polar plot can be in different projections, including the tangent projection (Bengston, 1980). The best-fit plane is represented by a great circle and the fold axis is displayed prominently.
For an example of a fold axis plot, click on this link:
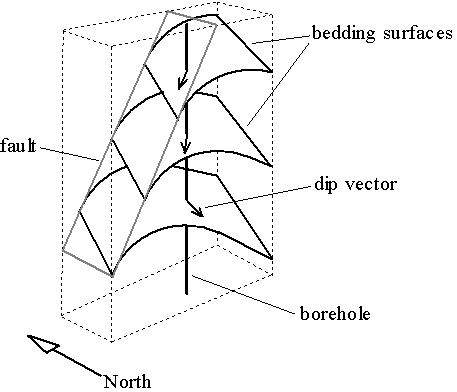
Below is a figure showing a borehole crossing a drag fold. The dip angle will change as the borehole encounters different parts of the drag fold. Although the strike of the fold axis is not the strike of the fault plane, the strike is the same as the strike of the fault cut when drawn on a map.
Following you will see the relationship of the dips above to the common (best-fit) plane and the fold axis.
The figures above © 1996 by Charles R. Berg.